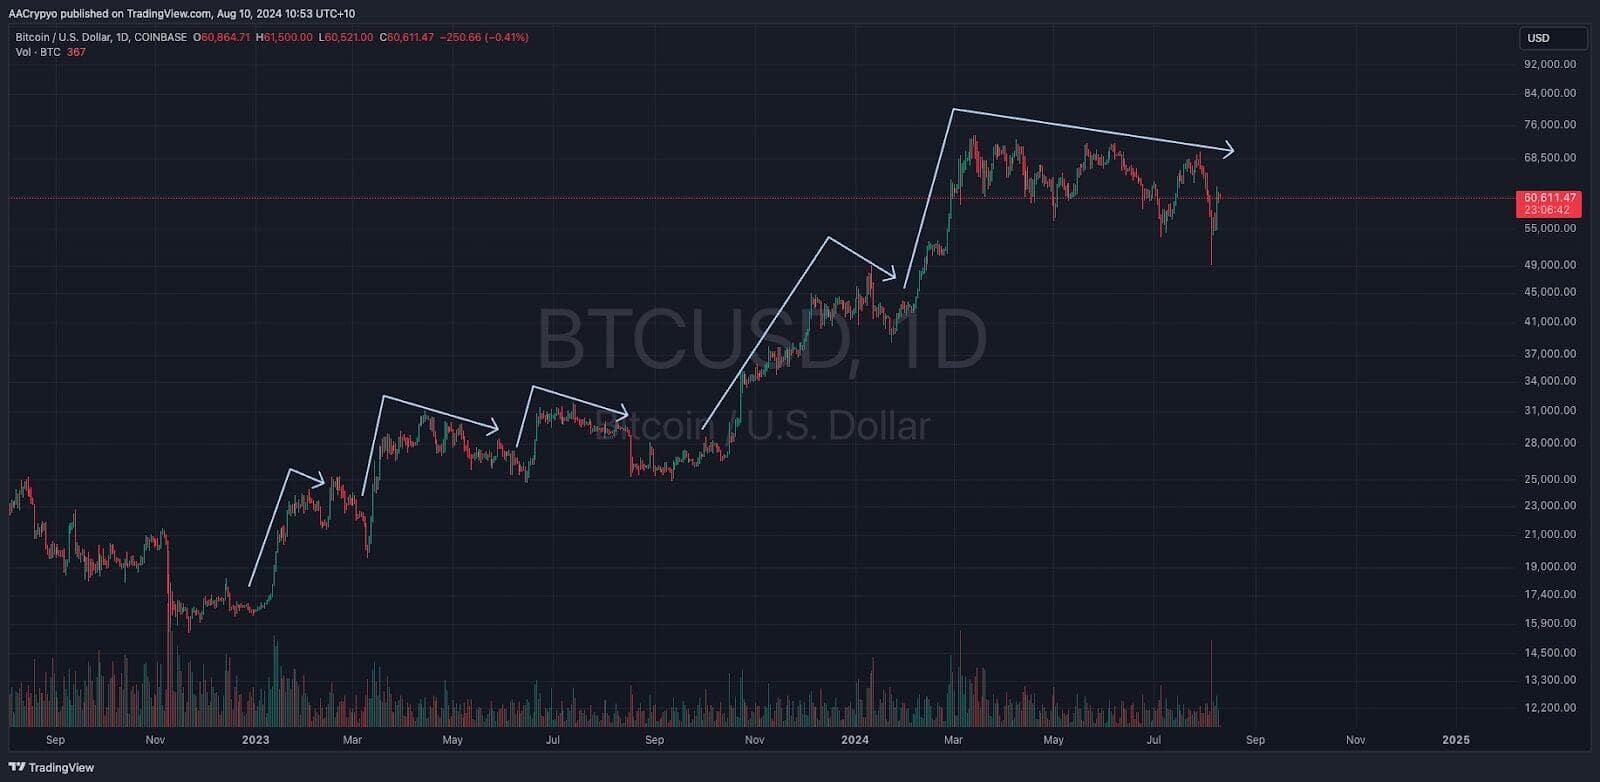
Following Bitcoins largest daily candle since October, it was expected that a pullback would occur to maintain a bullish structure. To those who are still new to the Crypto markets, nothing good ever goes just straight up. A healthy chart of an asset is one that experiences a consolidation phase after a move up.
A healthy chart may look like stairs or a number of flags. This chart below shows the current Bitcoin bull run, which has demonstrated many instances of these consolidation periods after a move up. Regardless of what time frame you chart with, to maintain bullishness, this structure is key.
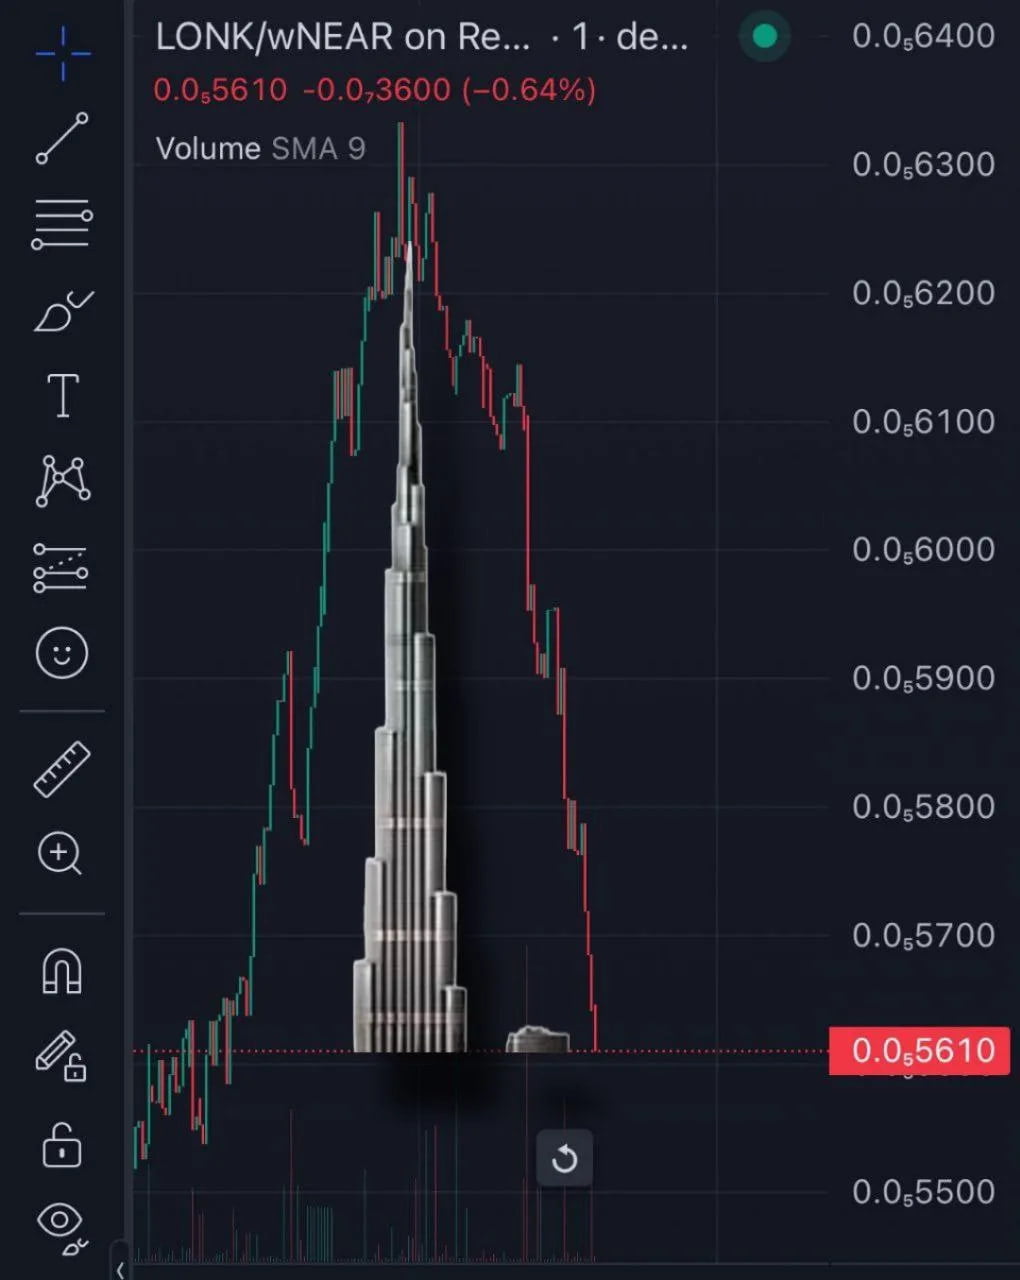
Within the Crypto space, there are chart patterns we refer to as the ‘Burj Khalifa’. This pattern is often found with sh*tcoins and meme coins alike, to keep things simple, it's when a chart looks like the building of the Burj Khalifa. With price rocketing straight up, before coming down just as fast. Whilst the gains may supersede anything you’ve experienced before, they often disappear before you can even think to take profit, leaving investors with worthless coins that were once in great profit. The following meme coin chart is a prime example of the ‘Burj Khalifa’ pattern.
BTC/USD Key Levels and Price Action:
BTC/USD Key Levels and Price Action:
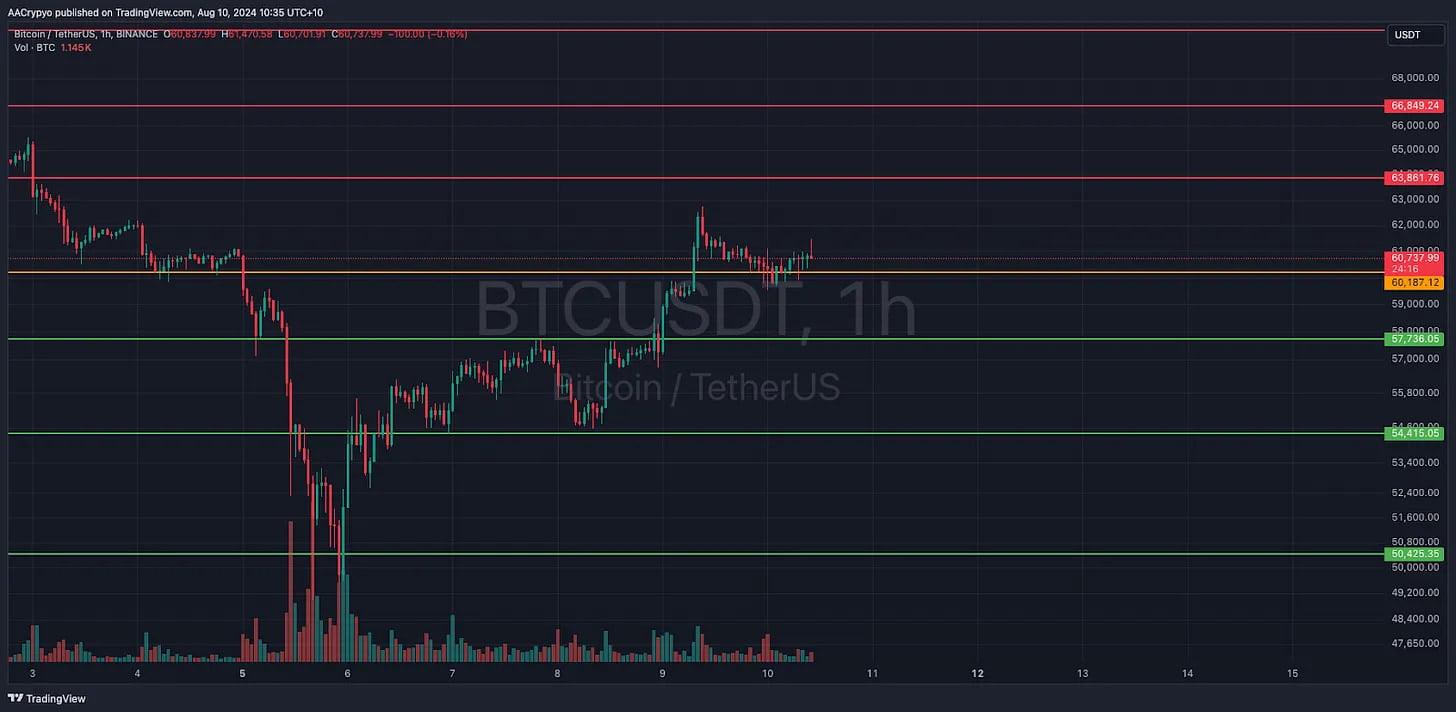
Bitcoin bulls remain in control, as mentioned yesterday the key support level for BTC sits at $60,200, this was tested overnight. This is of no concern, as the bullish structure remains. Whilst we sit at this level, it provides a good opportunity to dollar cost average into your BTC allocation, as buying at support rather than into resistance often yields higher returns. Yesterday’s target of $63,800 remains and likewise $57.5k to the downside if the support fails.
BTC Total ETF Flows for 9 Aug: $ -99.3 Million
ETH/USD Key Levels and Price Action:
ETH/USD Key Levels and Price Action:
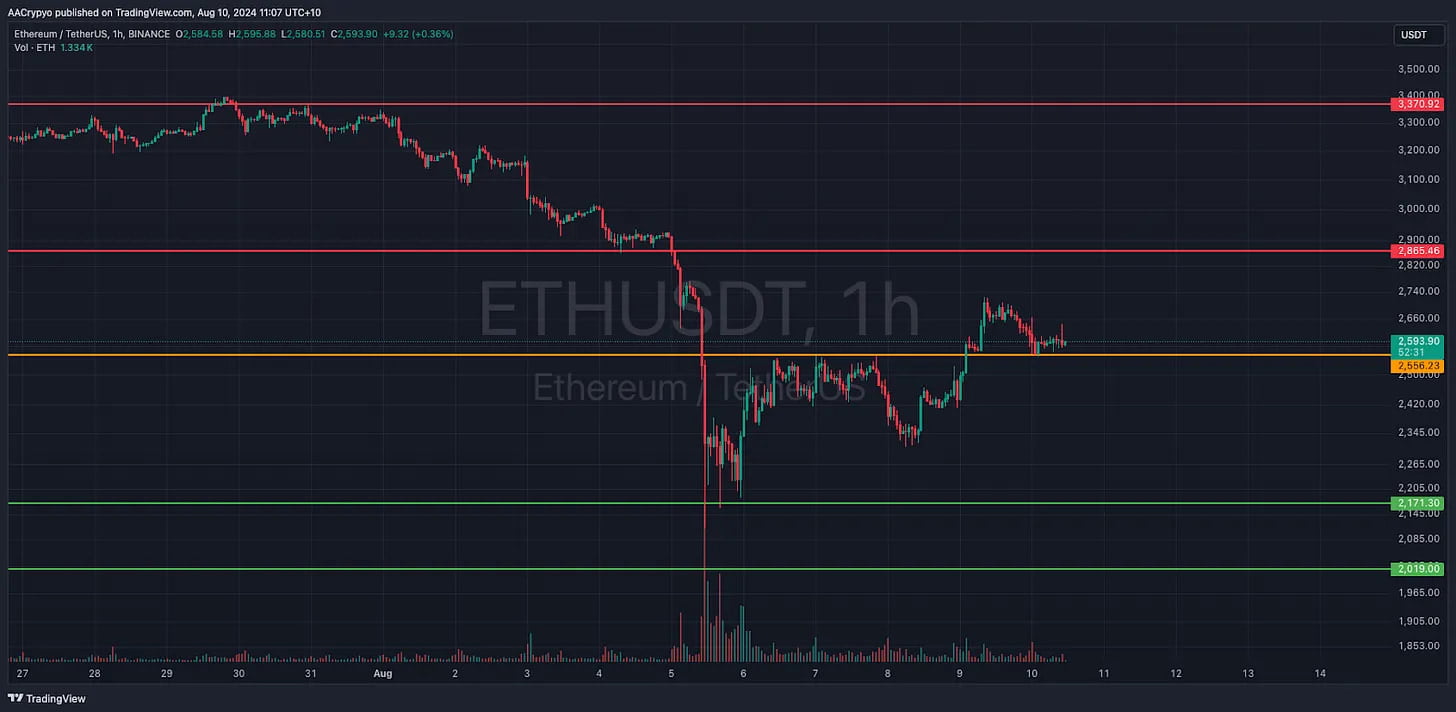
Similarly to Bitcoin, Ethereum has experienced a retest of the key support level $2,556. We still maintain a bullish bias whilst above this and our target for ETH remains at $2,865. Meanwhile our expectation for ETH if we are to lose the current support would be a retest of the $2,171 support level.
ETH Total ETF Flows for 9 Aug: $ -35.4 Million
Written by Alexandar Artis
Create a brokerage account today
Reach out to us at Stormrake for further market insight and allow us to help you navigate the sea of mania and laser-eye memes, so that you can realise your goals in the market!
No Advice Warning
The information in this newsletter is general only. It should not be taken as constituting professional advice from the author - Stormrake PTY LTD.
Stormrake is not a financial adviser and does not provide financial product advice. You should consider seeking independent legal, financial, taxation or other advice to check how the information relates to your unique circumstances. Stormrake is not liable for any loss caused, whether due to negligence or otherwise arising from the use of, or reliance on, the information provided directly or indirectly, by this newsletter.
Disclaimer
All statements made in this newsletter are made in good faith and we believe they are accurate and reliable. Stormrake does not give any warranty as to the accuracy, reliability or completeness of information that is contained here, except insofar as any liability under statute cannot be excluded. Stormrake, its directors, employees and their representatives do not accept any liability for any error or omission in this newsletter or for any resulting loss or damage suffered by the recipient or any other person. Unless otherwise specified, copyright of information provided in this newsletter is owned by Stormrake. You may not alter or modify this information in any way, including the removal of this copyright notice.Copyright © 2024 Stormrake Pty Ltd, All rights reserved

