After many months of speculation, market game theory and heated discourse online – we’re now at decision time. The US FED are scheduled to meet early tomorrow morning and by the time you wake up and make that fresh coffee, looking at the daily market news we’ll have definitive action being taken on monetary policy. This will shape the coming years not only the broader traditional markets globally, but largely impact the foreseeable future in this current Cryptocurrency Bull run we’re currently in and leading into 2025 and beyond. The US FED have been waiting for the right macro-economic conditions to present themselves before pivoting on their hawkish and aggressive interest rate stance, consequently giving us the rate rises we’ve been subjected to for over the last 2 years. All of this is about to change in the next 24 hours. As we’ve mentioned in previous articles discussing the impact of a return of Doveish monetary policy, there’s only one way this goes in the long term. Wealth inequality unfortunately seems like it’s here to stay and it’s up to us individually to understand how to navigate an economic climate of perpetual inflation and price appreciation so we can get ahead of the curve and capitalize off this. Let’s take a deep dive into what the future might look like.
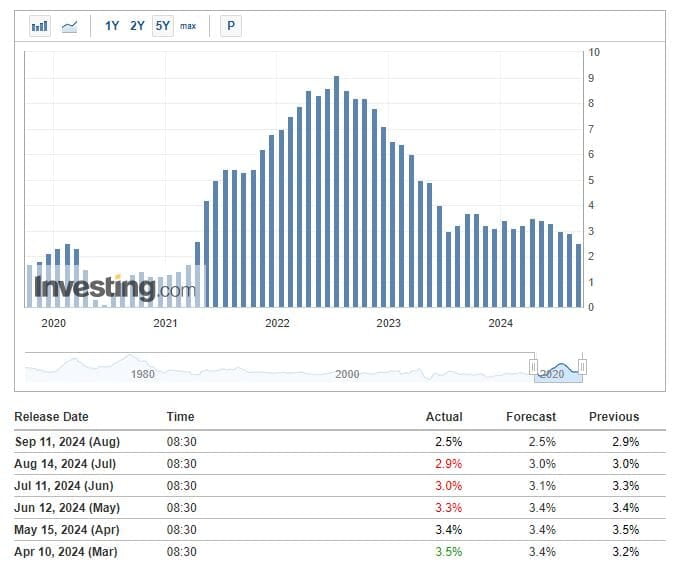
One key element, if not the most important that the FED has taken into consideration in recent years and months is the on-going inflation crisis seen in not just the US but globally as a result of monetary policy that was at or near zero for far too long prior and in response to the pandemic. With this being said, since the aggressive rate hike cycle since 2022, the FED has observed that inflation metrics have since significantly cooled off, predominantly in this year. Chairman Powell and the Board’s message in recent years was to target a 3% inflation year-on-year (YoY) on the higher end of tolerance with 2.5% YoY being on the lower. This lower end of the tolerance band is exactly where the data suggests we sit currently with the recent September 11th CPI release coming in as expected at forecasted levels.
This has allowed the FED to seed a narrative that the projected recovery of the macro-economic landscape is taking place, paving way for the FED to loosen their grip on rates and allow them to re- commence yet another easing cycle of lower rates for the foreseeable future. While lower rates is generally aimed at creating a bullish signal to the markets – a sign of things getting better; it’s also prudent to ask why rates are being lowered in the first place - is it truly because of a recovery and a sign of beating the aforementioned inflation once and for all, or is it instead because of other factors where perhaps the FED see an impending economic slowdown, therefore a rate cut here may save the markets some price shock later on down the road. Let’s explore some possible scenarios.
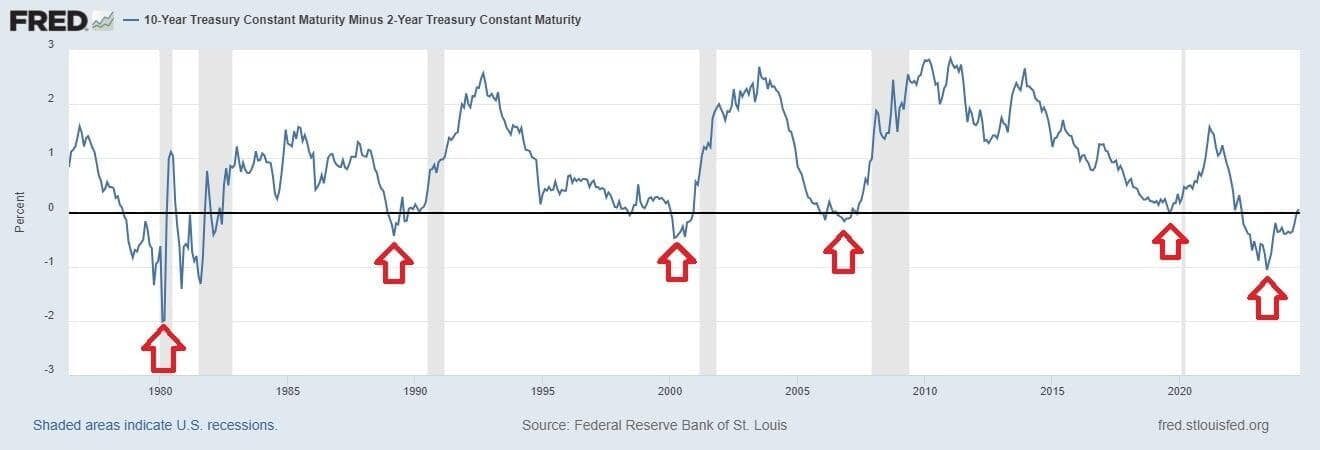
Historically, the FED has almost always cut rates in the lead up to a recession, which in fact is a sign of weakness in the real economy in the short-medium term. One important indicator that the FED use to determine the likelihood of an impending recession is by looking at the Yield Spread between the 2 year and 10 year US treasury yields, also commonly referred to as the “Yield Curve.” This Yield Curve allows the FED to see if there’s an unnatural rate of return where a 2 year Treasury Bond actually nets a higher return than a longer, more risky 10 year Bond. This in-turn forces the market to instead of looking into the distant future for safer more profitable returns, it inversely enables and reinforces more near-sighted speculative and risky investing for a higher return, creating a compounding bubble that eventually leads to a watershed moment and bust cycle. Hence, this flipping of sentiment is called a “Yield Curve Inversion” and can be used ahead of time to predict said recessions. As you can see below, each time an inversion took place between the Yield spread of 2/10 Yr US treasuries in the grey columns (timeframe) a recession took place shortly after.
Whilst this is an indication of potential weakness in the real economy, this doesn’t necessarily apply to the price economy of the markets immediately. Essentially, the macro-economic reality of the world and price may impact one another eventually and there is correlation, however said correlation doesn’t equate to immediate causational outcomes on each other. Have you ever wondered why when there is bad news the markets still manage to find a way in the short term to print new All Time High’s? This is why. The same can be said for negative prices to the downside without any significant shift in the macro. Price is irrespective of the realities of the world, until it no longer isn’t. This is because it takes time for the consequences of actions to be seen and the delay between the two is where uninformed market participants may get caught out. Does this mean that I’m perma-bearish until we inevitably take the medicine for yet another round of monetary easing that’ll surely create another inflationary cycle in the long term? Absolutely not and I’ll show you why with the last two most recent recession examples.
The last two times the Yield curve inverted and then reversed their inversions back to a positive spread where the longer bonds yield more again as they normally should, according to the FED’s own chart above were in September 2019 (prior to the initial pandemic recession) and in April 2006 (prior to the Global Financial Crisis). In both cases once the reversion took place, US indices kept climbing and made new All Time Highs in subsequent months. When the Inversion took place in August 2019, just a mere month later it reversed back to normal, albeit being shortly lived we saw prices keep making new highs until February of 2020 where it then stalled out on the fears of the pandemic spreading globally and talks of impending lockdowns. The S&P500 was able to gain an additional 15% at All Time High prices near $4000 per contract before the crash began.
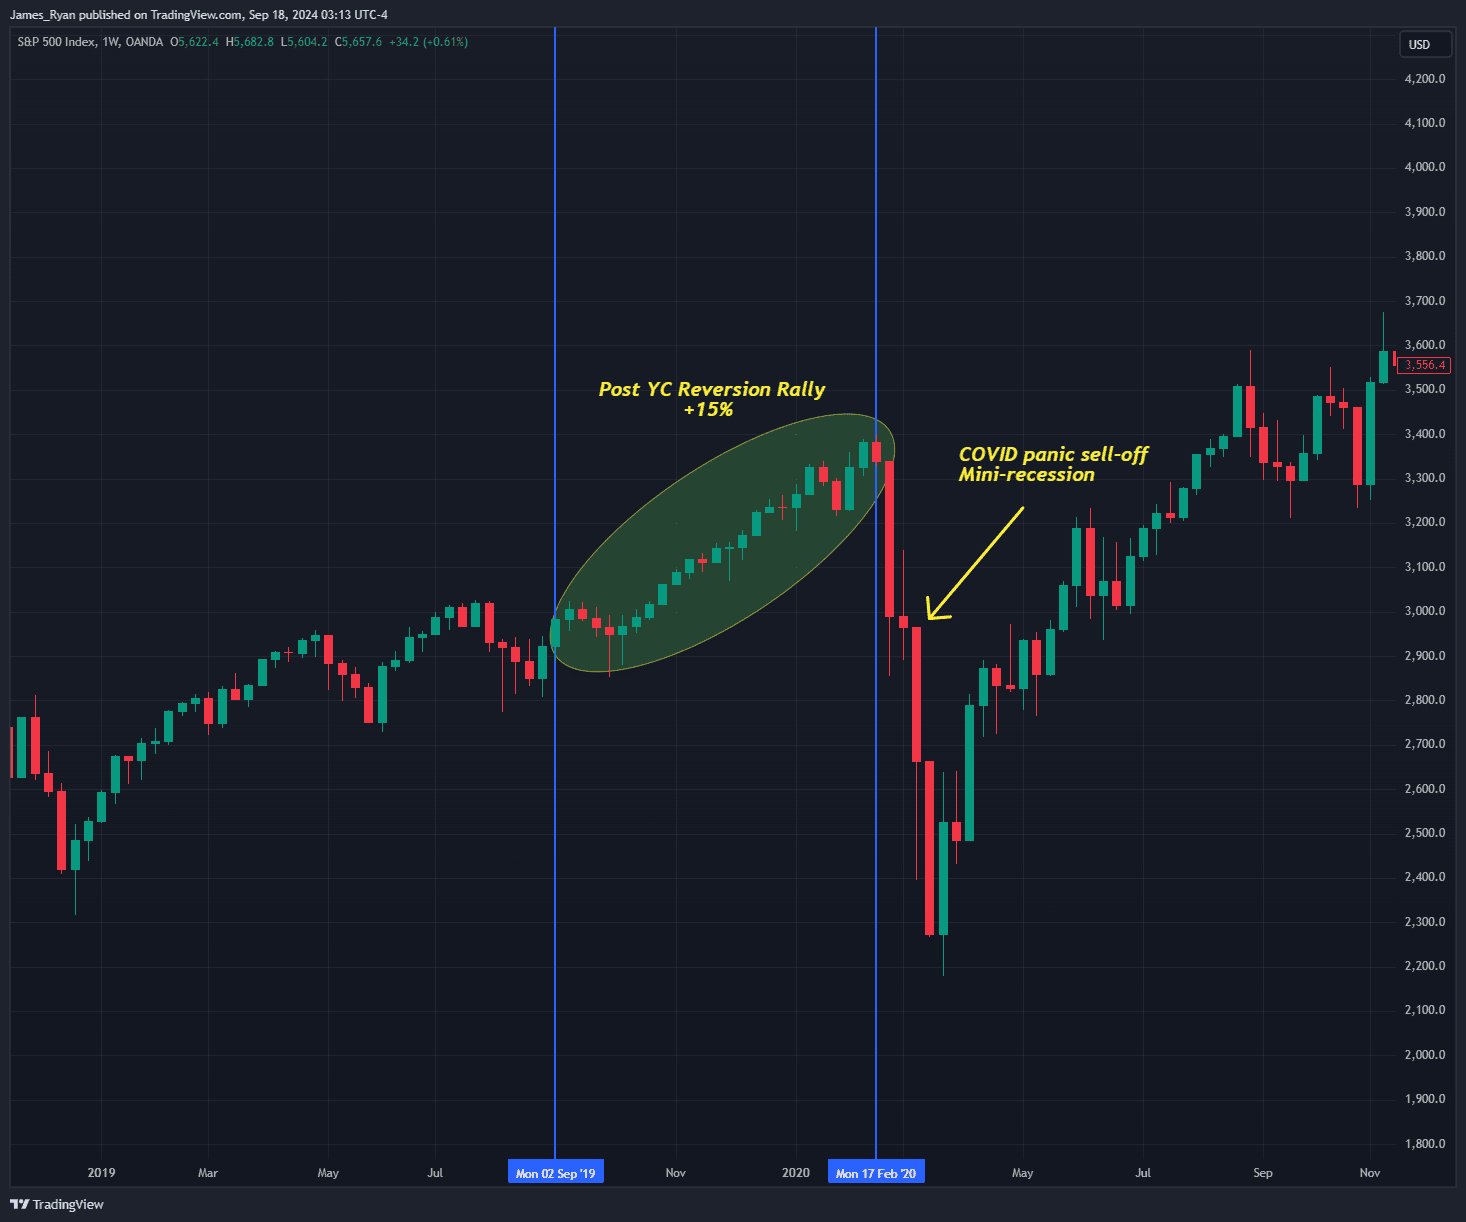
A clearer view of the above chart can be found here: https://www.tradingview.com/x/pCbfIZmj/
The biggest crash of all was in-fact the Global Financial Crisis, caused by the imploding of the Sub-Prime mortgage market and bad debt rife throughout the US banking sector during the late 2000’s that led to a 58% correction over two years in the S&P500 and trillions of dollars in losses worldwide. The initial inversion took place in February 2006, although the reversion back up started in April 2006 just two months later, before re-inverting again. Once the initial normalization reversion took place in April ’06 however, the market made sure to keep printing All Time High’s until it topped-out in October 2007 @ $1578.5 per contract. Inevitably it took some time to determine that a recession had begun but after the lagging GDP and employment metrics came through by late 2008, it was determined that the US had already been in a recession since December 2007.
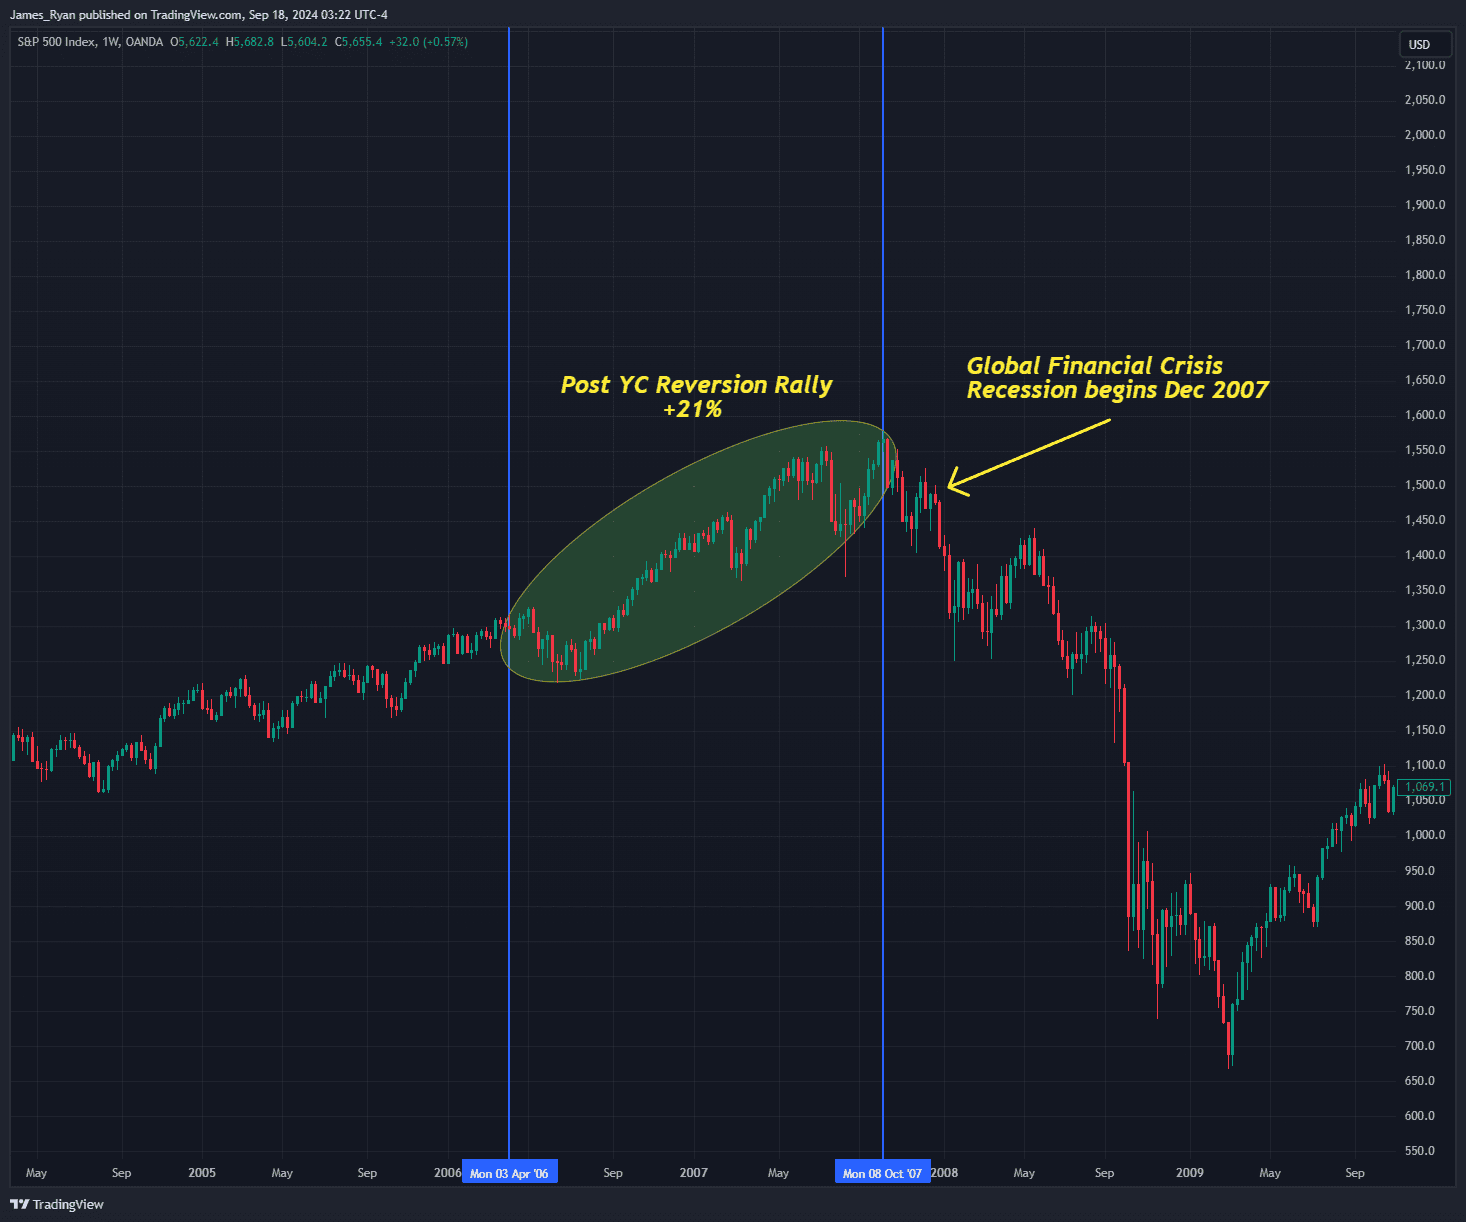
A clearer view of the above chart can be found here: https://www.tradingview.com/x/cBDunOLi/
In both instances, once a recession was all but officially confirmed on paper, the FED intervened with rate cuts in order to prop the market back up, re-inflating the inflationary bubble once more without taking the necessary medicine needed, being; sustained high interest rates in order to correct the damage done by reckless monetary and fiscal policy of which got the markets into trouble in the first place. As the FED in both instances also Doveish-ly pivoted on rates well into the sell off’s, already being deep in a sea of red, it’s a wonder how things might play out this time around as the pivot is coming well before prices have been overly bearish, in-fact in the broader traditional markets everything is at, if not near All Time High’s again due to the bullishness of the aforementioned easing inflation throughout the year.
Currently, as you might’ve already seen – yes, we are in an inverted yield curve, and yes we are now as of this month starting to cross the threshold again where a re-normalizing of spreads and a reversion seems to be taking place. For these reasons, ultimately, I’m bullish in the near term on prices, especially with a looming US Election which could very well help in rallying market sentiment if we see a Trump win, much like it did last time in November 2016. Bitcoin in the midst of all the above is still holding our Bull Flag pattern along with key support levels, bouncing off from the sell off and lows of our previous months analysis as predicted and comfortably still rangebound in our accumulation pattern, meaning it’s well poised to benefit off the doveish monetary policy and FED Pivot we’re about to undergo.
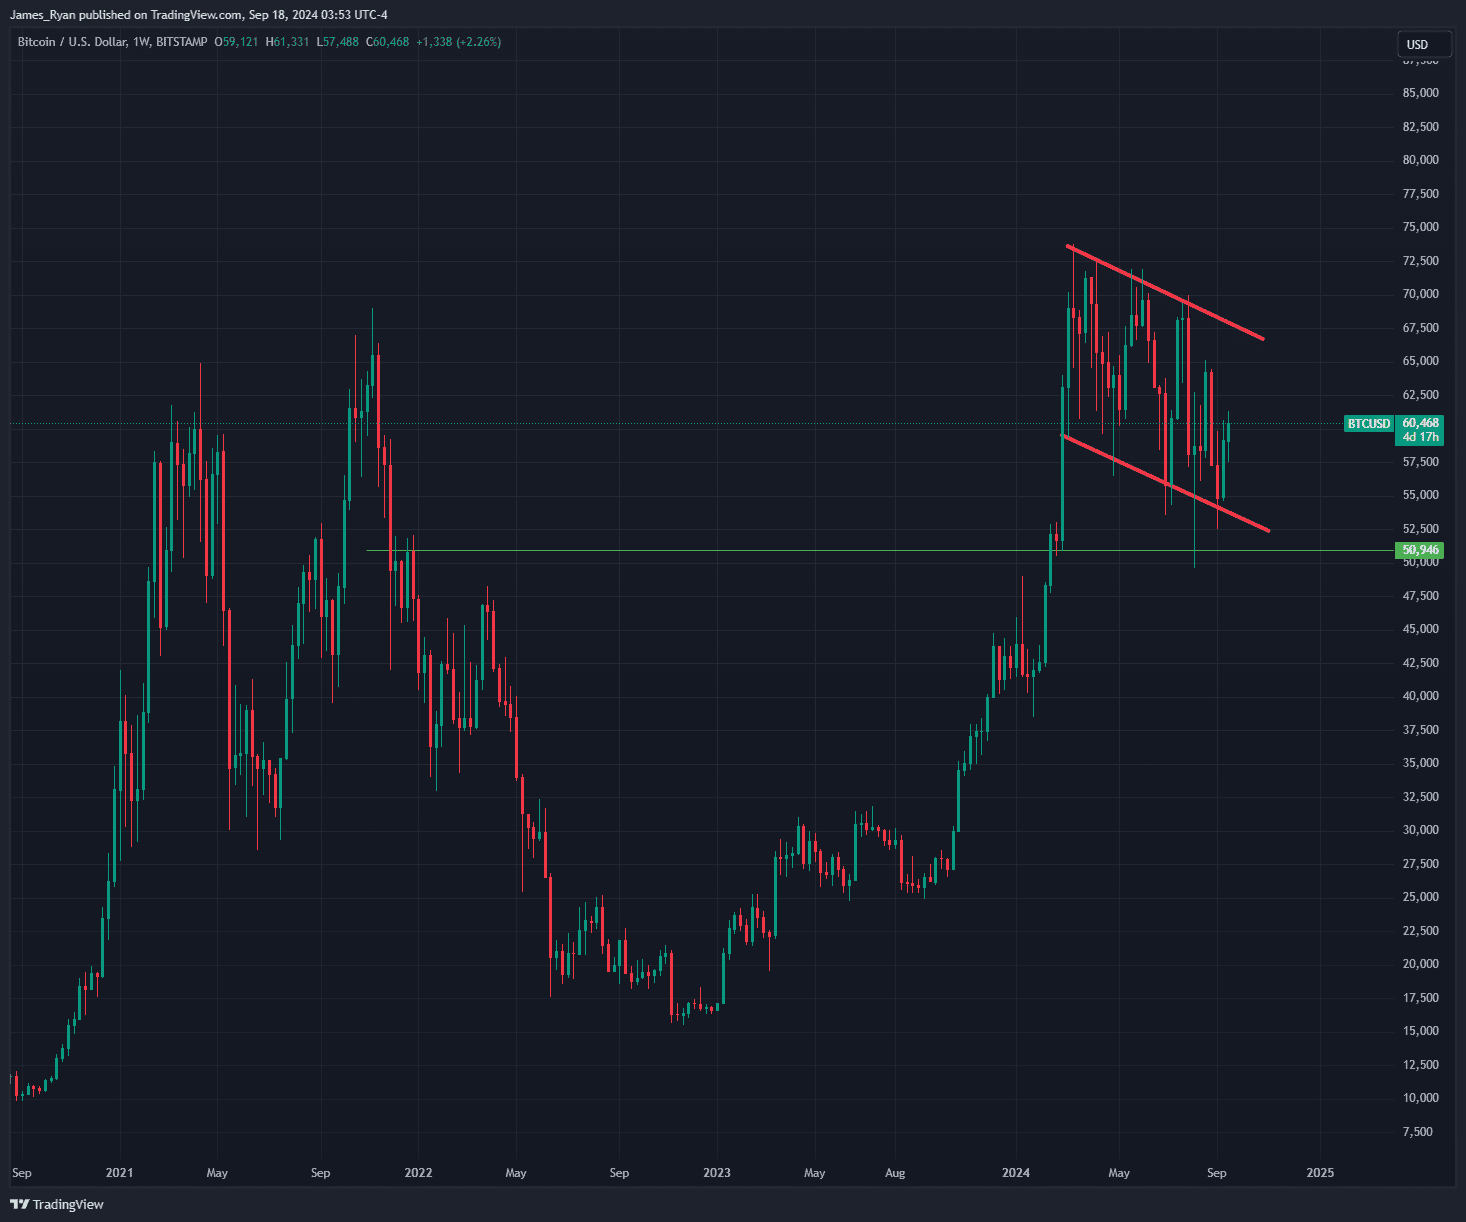
A clearer view of the above chart can be found here: https://www.tradingview.com/x/KH0mcPjm/
It seems likely that the US FED are pricing in a 25 basis-points cut, of which is being forecasted so I’d expect to see the announcement early tomorrow morning echo the same market expectations, knowing that Chairman Powell and the board want to avoid any surprises given how the market may not know how to react to an overly doveish 50 basis point cut so quickly, possibly spooking the markets into thinking there may be an immediate issue at hand. What we will need to see happen after this is a monitoring closely of any red flags in the macro-economic landscape that could hinder any rally coming out of this, perhaps taking an eagle-eyed approach to spottng any cracks or leaks in the robustness of the banking sector, Bond market or geopolitical tensions. Or perhaps the catalyst could simply be yet another inevitable inflation cycle down the road, deriving as a consequence to FED’s eagerness to carry on printing the market back up just that little bit further.... Time will tell, but we aren’t going anywhere. Strap in and buckle up, because this is where the fun begins!
Written by James Ryan
Create a brokerage account today
Reach out to us at Stormrake for further market insight and allow us to help you navigate the sea of mania and laser-eye memes, so that you can realise your goals in the market!
No Advice Warning
The information in this newsletter is general only. It should not be taken as constituting professional advice from the author - Stormrake PTY LTD.
Stormrake is not a financial adviser and does not provide financial product advice. You should consider seeking independent legal, financial, taxation or other advice to check how the information relates to your unique circumstances. Stormrake is not liable for any loss caused, whether due to negligence or otherwise arising from the use of, or reliance on, the information provided directly or indirectly, by this newsletter.
Disclaimer
All statements made in this newsletter are made in good faith and we believe they are accurate and reliable. Stormrake does not give any warranty as to the accuracy, reliability or completeness of information that is contained here, except insofar as any liability under statute cannot be excluded. Stormrake, its directors, employees and their representatives do not accept any liability for any error or omission in this newsletter or for any resulting loss or damage suffered by the recipient or any other person. Unless otherwise specified, copyright of information provided in this newsletter is owned by Stormrake. You may not alter or modify this information in any way, including the removal of this copyright notice.Copyright © 2024 Stormrake Pty Ltd, All rights reserved

