Crypto markets have been showing consistent green since the recent interest rate cut. While this price action is encouraging and builds excitement, it is still premature to declare the start of the next big rally. From a technical standpoint, we’re not out of the woods just yet.
Zooming Out: A Technical Look at BTC
Zooming Out: A Technical Look at BTC
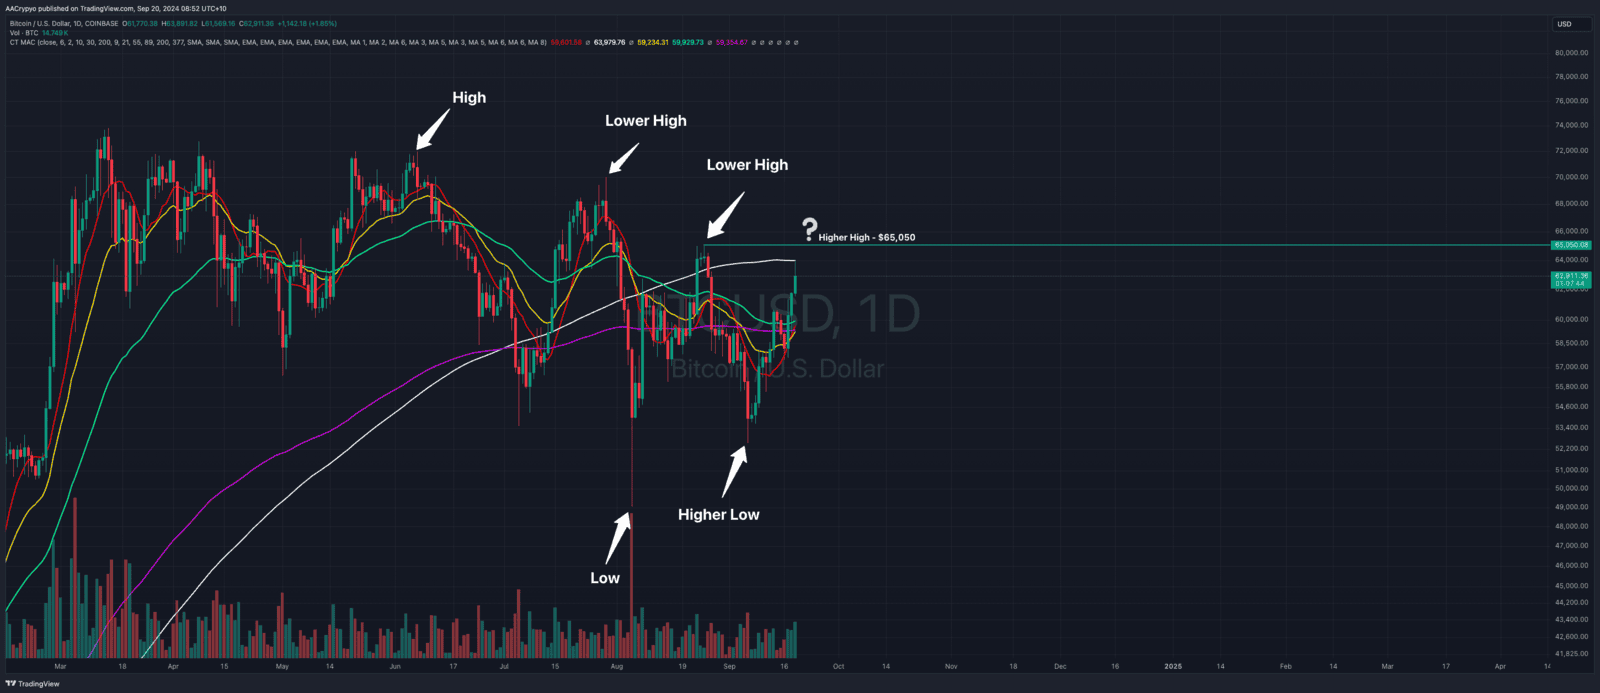
Let's take a step back and examine a broader timeframe. Below is a daily BTC chart. The key concern here is the persistent pattern of lower highs. Lower highs occur when the price rallies but fails to break above the previous high, leading to a reversal. As shown on the chart, this trend has been in place since the first lower high on July 29th. A month later, another rally took place but again failed to surpass the high set in July. We are currently seeing another rally, but for BTC to break the downtrend, it needs to close above $65,050 USD, creating a higher high. If it fails to do so, the downtrend continues, and this breakout will be rendered insignificant.
The Battle at the 200-Day SMA
The Battle at the 200-Day SMA
Before we can talk about creating a higher high, there’s a significant hurdle in the form of the 200-day SMA (Simple Moving Average). This is one of the most respected indicators across all markets, offering major resistance and support for assets. Currently, the 200-day SMA for BTC is at $63.9k, aligning with a key hourly resistance level for Bitcoin.
As mentioned, the 200-day SMA is a formidable level of resistance. Bitcoin must break through this level before we can discuss any meaningful upside momentum. The fact that this aligns with hourly resistance only adds to its significance. If BTC can break and close above the 200-day SMA, it would signify a strong shift in momentum.
However, this series of lower highs still indicates a downtrend. Despite this, a long-term bullish pattern remains intact.
The Battle at the 200-Day SMA
The Battle at the 200-Day SMA
Before we can talk about creating a higher high, there’s a significant hurdle in the form of the 200-day SMA (Simple Moving Average). This is one of the most respected indicators across all markets, offering major resistance and support for assets. Currently, the 200-day SMA for BTC is at $63.9k, aligning with a key hourly resistance level for Bitcoin.
As mentioned, the 200-day SMA is a formidable level of resistance. Bitcoin must break through this level before we can discuss any meaningful upside momentum. The fact that this aligns with hourly resistance only adds to its significance. If BTC can break and close above the 200-day SMA, it would signify a strong shift in momentum.
However, this series of lower highs still indicates a downtrend. Despite this, a long-term bullish pattern remains intact.
The Bull Flag: A Long-Term Pattern in Play
The Bull Flag: A Long-Term Pattern in Play
Bitcoin has been forming and maintaining a Bull Flag pattern since reaching its all-time high back in April. As highlighted by James Ryan in our recent article ‘The Upcoming FED Pivot – It’s Time to Decide’, Bitcoin is still holding within this Bull Flag pattern, along with key support levels. BTC has bounced back from recent sell-offs and remains range-bound in the accumulation phase. This puts Bitcoin in a good position to benefit from dovish monetary policies and the FED pivot.
Once BTC breaks the streak of lower highs and confirms a bullish trend reversal, the combination of the Bull Flag pattern and favorable monetary policy should propel BTC to new all-time highs. The only question is: when?
Stormrake Spotlight: FANTOM ($0.635)
Stormrake Spotlight: FANTOM ($0.635)
FTM has entered a consolidation phase after a major run-up last week. It remains 27% up from our first mention earlier in the week and peaked at 36% overnight. This consolidation is healthy and presents a potential buying opportunity before the next leg up.
BTC/USD Key Levels and Price Action:
BTC/USD Key Levels and Price Action:
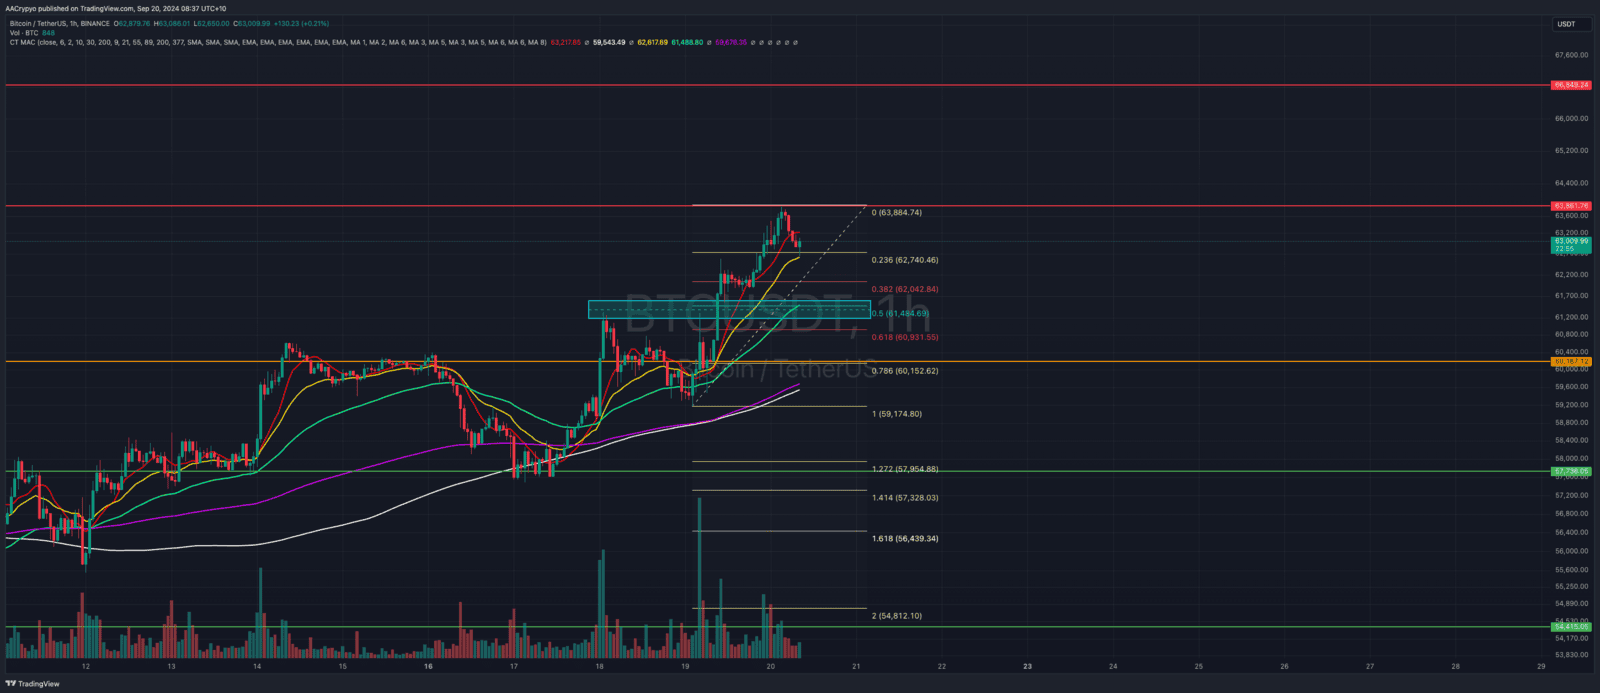
As forecasted, Bitcoin reached the key resistance level of $63.8k and was subsequently rejected. As mentioned above, this level is proving to be a significant barrier for BTC to break through. A healthy pullback for Bitcoin would bring it down to the $61.5k area, where the confluence of the 0.5 Fibonacci level and the 55 EMA (Exponential Moving Average) meets. This pullback would provide a buying opportunity while also offering insight into the strength of the current move up. If this level fails to hold, BTC could drop further to the $60.1k support, which would play into the Bears hands.
BTC Total ETF Flows for 19 Sep: $ + 9.5 million
(ETF flow data is sourced from https://farside.co.uk/btc/ and reflects figures at the time of writing.)
(ETF flow data is sourced from https://farside.co.uk/btc/ and reflects figures at the time of writing.)
ETH/USD Key Levels and Price Action:
ETH/USD Key Levels and Price Action:
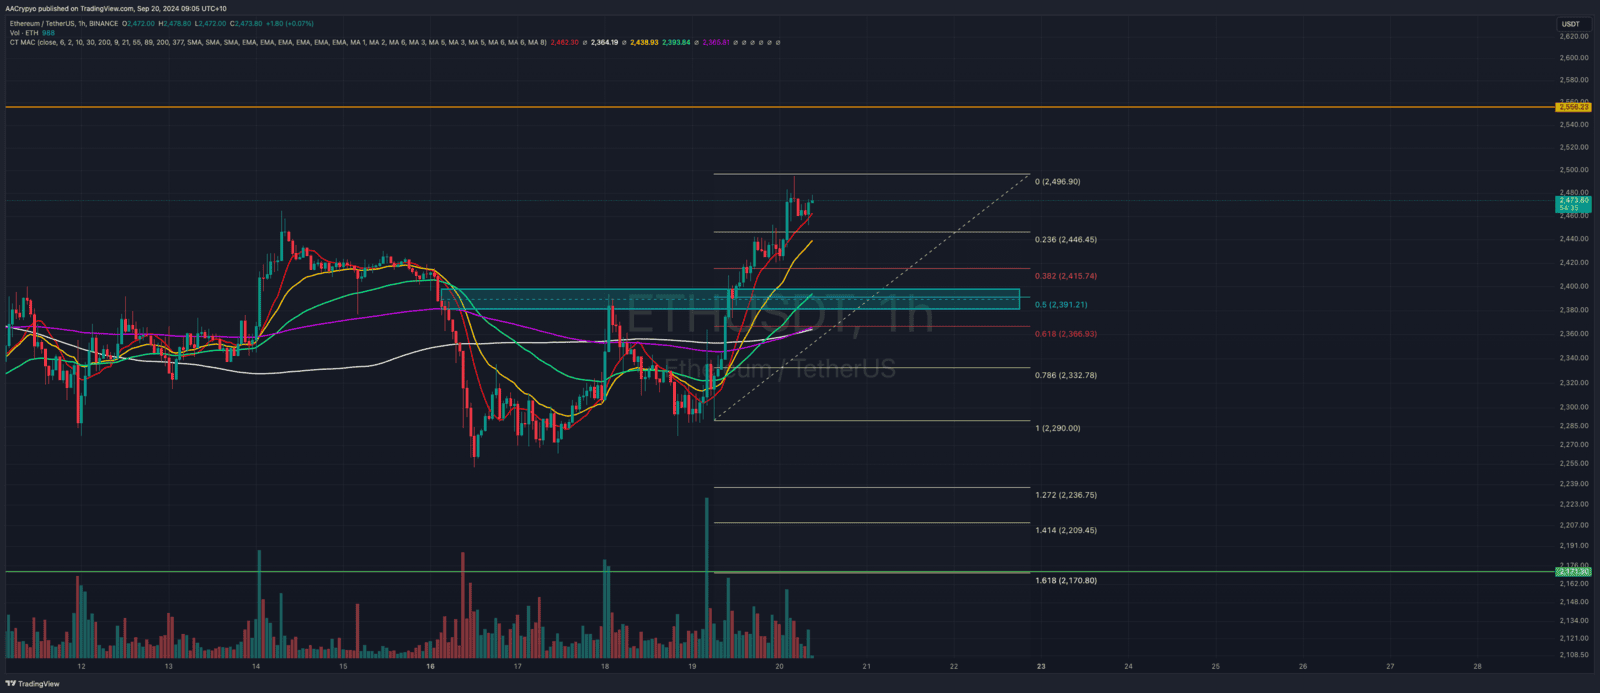
Ethereum continues to inch closer to its $2,556 resistance level, currently 3.4% away at the time of writing. However, ETH is lagging behind BTC in terms of price action. Given Bitcoin’s rejection at key resistance, ETH is likely to follow suit. Like BTC, ETH has a confluence of support at the 0.5 Fibonacci and 55 EMA, around $2,391. A pullback to this level would be healthy and offer a consolidation opportunity before attempting to break through resistance once again. If this pullback area fails to hold, it could signal a reversal, sending ETH down to its next support level at $2,171.
ETH Total ETF Flows for 19 Sep: $ - million
(ETF flow data is sourced from https://farside.co.uk/eth/ and reflects figures at the time of writing.)
To receive the Morning Note in your inbox. Subscribe here: https://stormrake.substack.com/
Written by Alexandar Artis
Create a brokerage account today
No Advice Warning
The information in this newsletter is general only. It should not be taken as constituting professional advice from the author - Stormrake PTY LTD.
Stormrake is not a financial adviser and does not provide financial product advice. You should consider seeking independent legal, financial, taxation or other advice to check how the information relates to your unique circumstances. Stormrake is not liable for any loss caused, whether due to negligence or otherwise arising from the use of, or reliance on, the information provided directly or indirectly, by this newsletter.
Disclaimer
All statements made in this newsletter are made in good faith and we believe they are accurate and reliable. Stormrake does not give any warranty as to the accuracy, reliability or completeness of information that is contained here, except insofar as any liability under statute cannot be excluded. Stormrake, its directors, employees and their representatives do not accept any liability for any error or omission in this newsletter or for any resulting loss or damage suffered by the recipient or any other person. Unless otherwise specified, copyright of information provided in this newsletter is owned by Stormrake. You may not alter or modify this information in any way, including the removal of this copyright notice.Copyright © 2024 Stormrake Pty Ltd, All rights reserved

